This is a data visualization that I made that I will potentially use in my final project:
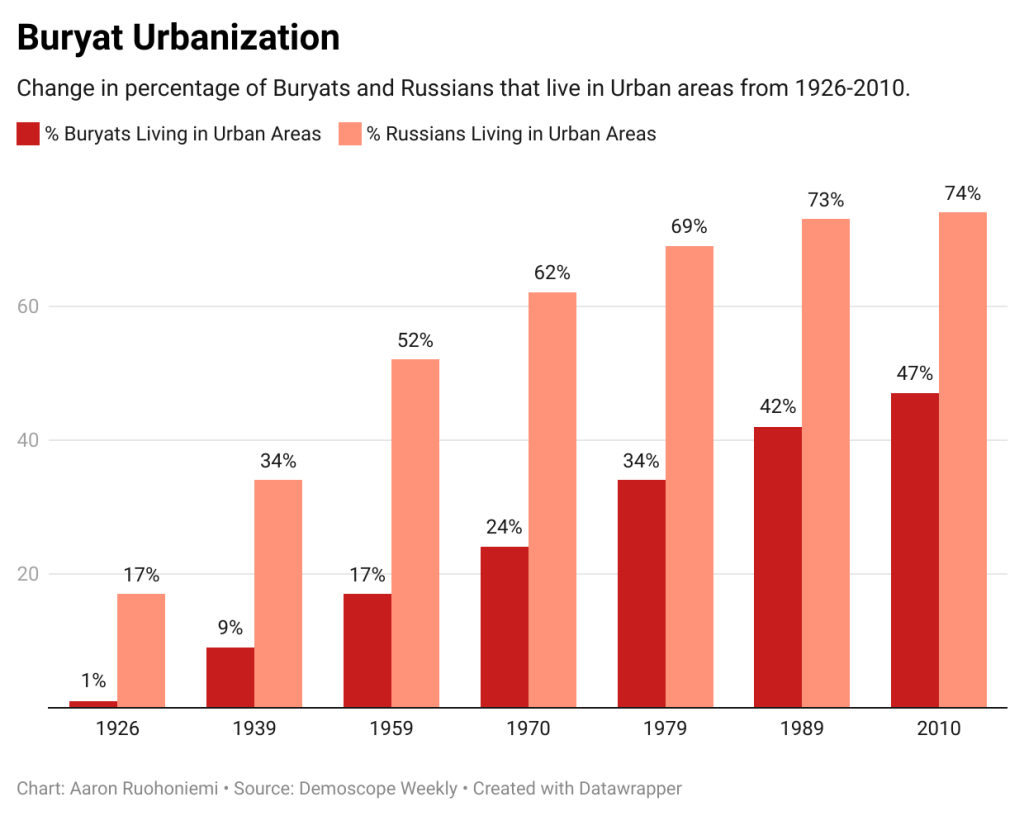
I was able to create this visualization in Datawrapper using Russian census data. My intention behind this visualization is to illustrate the magnitude of urbanization in Russia (and more specifically, Buryatia) since the beginning of the Soviet Union. This urbanization is important because it is a leading factor in language and culture loss worldwide. Especially for the Buryats, who are traditionally nomadic, to move to a city erases their entire way of life and disconnects them from their heritage. This graph is a poignant illustration, but the actual numbers aren’t very important, so I will have this embedded within my story without it being a main focus.